A Python program for drawing spontaneously emerging paths in Waddington's Epigenetic Landscape by Monte Carlo estimation
Version 1.0.0 requires Anaconda 3:Python 3.6
Description of MCLand
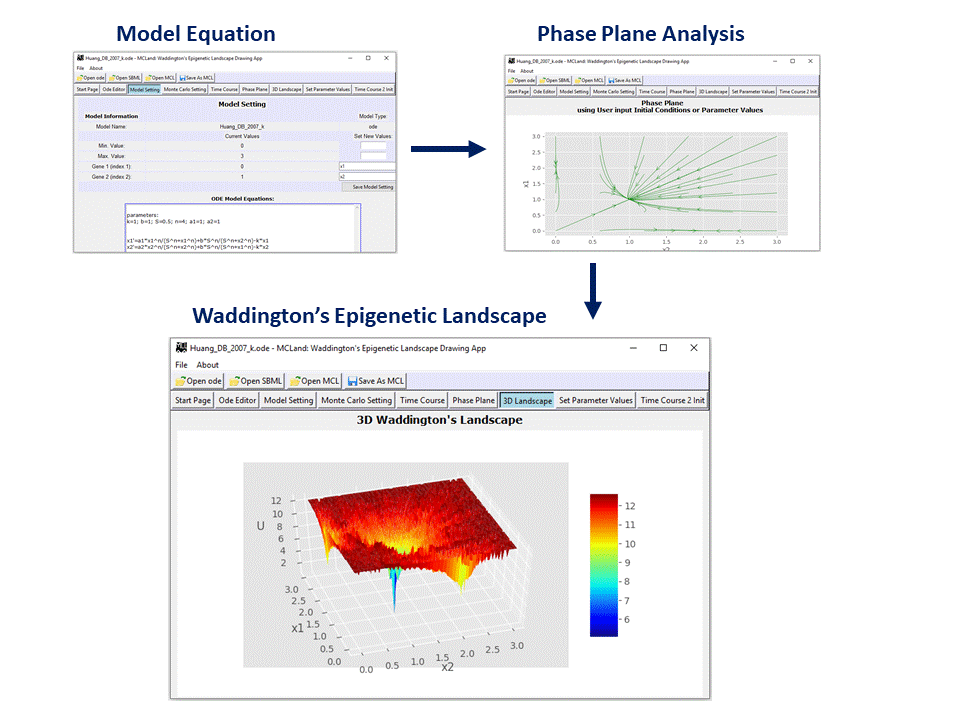
MCLand is a graphical user interface software tool [1] that allows user to model and visualize Waddington's epigenetic landscape for gene regulatory network. MCLand is a user friendly software tool based on Monte Carlo method to calculate and visualize quasi-potential landscape [2]. MCLand is designed with graphical user interface to enable user to model gene regulatory network in the format of XPPAUT .ode file. Model equations are in ordinary differential equations with rate constants or parameter values. An editor is provided to user to edit their model equations in XPPAUT ode. Users who are familiar with XPPAUT will find MCLand very compatible as MCLand development is following the design of XPPAUT. User may change a parameter value and plot the Waddington’s epigenetic landscape. Users can save their model in ode file and simulated Waddington’s epigenetic landscape in MCLand file format (Python pickle .pckl). MCLand also supports SBML model file. For details please read our paper [1] or listen to the ScienceCast.
The source code and documentation are available at GitHub.MCLand features include:
• Time-course simulation
• Phase plane analysis
• Waddington’s epigenetic landscape
Example of the Graphical Interface:

Compared to the state-of-the-art software NetLand [3]:

References
1. Chong, K. H. and Zhang, X. and Zhu, L. and Zheng, J. MCLand: A Python program for drawing emerging shapes of Waddington's epigeneticlandscape by Monte Carlo simulations. bioRxiv, 2024--01 (2024).
2. Zhang, X., Chong, K. H., Zhu, L. & Zheng, J. A monte carlo method for in silico modeling and visualization of waddington’s epigenetic
landscape with intermediate details. Biosystems 198, 104275 (2020).
3. Guo, J., Lin, F., Zhang, X., Tanavde, V. & Zheng, J. Netland: quantitative modeling and visualization of waddington’s epigenetic landscape
using probabilistic potential. Bioinformatics (2017).